
Yara Simon · 12 October 2026
Mapping Cross-Platform Data Correlations to Identify Emerging Search Opportunities in Niche Markets
Professionals in digital analytics examine correlations across multiple data sources to uncover search patterns that traditional single-platform tools often miss, and researchers note that combining query volume from major engines with social signals and e-commerce metrics reveals opportunities in specialized segments. Data from October 2026 shows increased activity in areas such as sustainable packaging materials and adaptive fitness equipment where interest spikes appear first on video platforms before migrating to text-based queries.
Understanding Cross-Platform Correlation Methods
Analysts align timestamps and normalize scales from sources including web search logs, social mention counts, and product sales records, then apply statistical techniques such as Pearson coefficients or time-series alignment to identify relationships that precede broader search growth. Observers note that a rise in forum discussions about plant-based protein alternatives often precedes increased searches for related recipes by several weeks, while data indicates similar patterns in hobbyist electronics where component availability on marketplaces correlates with tutorial searches on video sites.
Key Data Sources and Integration Approaches
Teams integrate information from public web indexes, application programming interfaces provided by social networks, and aggregated transaction data from retail platforms, and they clean records to remove duplicates before running correlation models. Government statistical agencies such as Australian Bureau of Statistics publish category-level consumption figures that analysts cross-reference with search volume trends, whereas academic studies from institutions like the University of Toronto demonstrate how sentiment scores extracted from microblogging services add predictive value when layered onto keyword datasets.
One study revealed that combining location-tagged posts with regional search data highlighted emerging interest in cold-weather camping gear in specific provinces months before national query volumes increased. Those who have examined these datasets observe that seasonal factors and platform algorithm changes can shift correlation strength, requiring periodic recalibration of models.
Identifying Signals in Niche Segments
Emerging opportunities surface when correlation scores exceed established thresholds across three or more independent platforms, and practitioners track metrics such as co-occurrence frequency between long-tail phrases and visual content tags. In the pet wellness category, for instance, increased mentions of specific herbal supplements on community forums aligned with rising searches for veterinary-approved alternatives, while transaction records from specialty stores confirmed early adoption before mainstream retailers stocked the items.
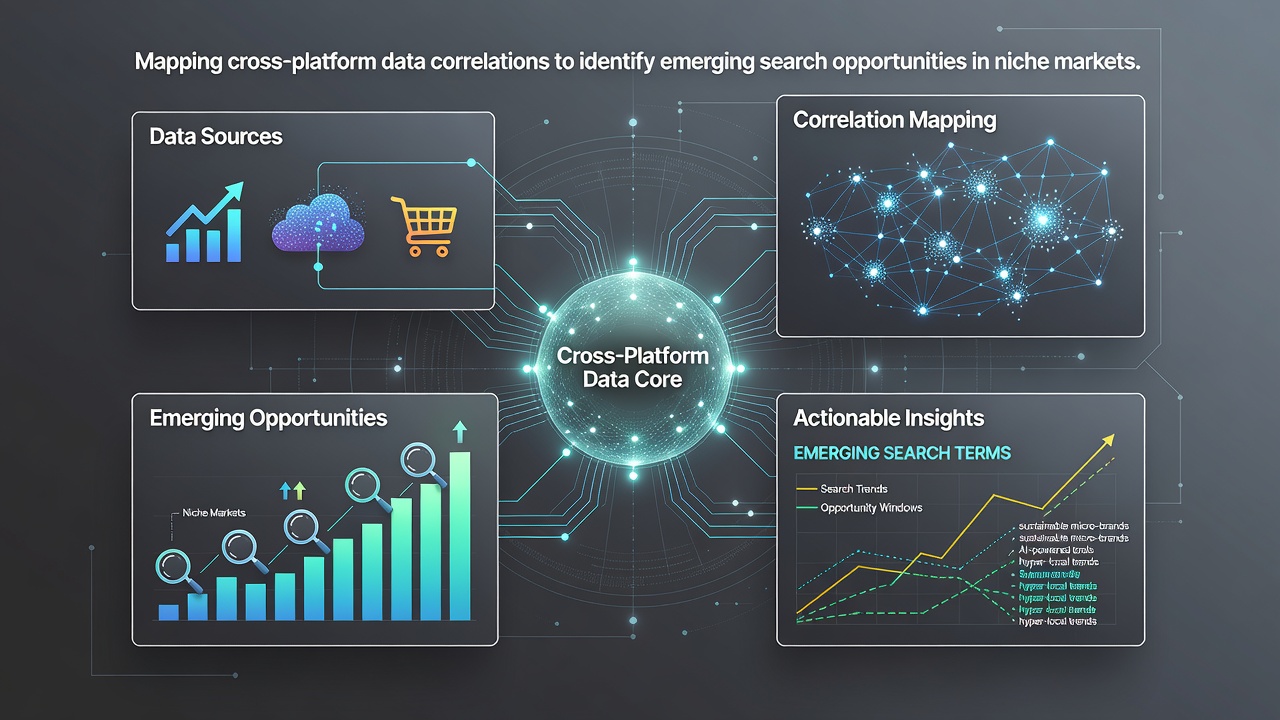
Researchers discovered similar patterns in home automation accessories where firmware update discussions on developer forums preceded instructional video queries and subsequent product searches. Data indicates that niche markets with lower overall volume but higher engagement density produce stronger early signals because participants tend to discuss topics across multiple channels simultaneously.
Practical Implementation Steps
Teams begin by selecting representative keywords and hashtags for a target niche, then pull historical data spanning at least twelve months to establish baseline correlations. They apply filters to exclude paid promotional spikes and focus on organic mentions, after which statistical software calculates lag times between platform activity and search volume changes. Reports from organizations such as the OECD provide standardized industry classification codes that help align disparate datasets during this process.
Those who've studied these workflows find that visualization tools displaying heatmaps of correlation strength across time periods help surface anomalies quickly. When a particular phrase shows rising correlation between social mentions and video completion rates, analysts add it to monitoring lists for further validation against sales data or site traffic logs.
Challenges in Data Alignment and Interpretation
Differences in data granularity, regional availability, and platform policy changes complicate direct comparisons, yet practitioners address these issues through resampling techniques and proxy indicators. Privacy regulations in various jurisdictions limit access to certain user-level signals, prompting reliance on aggregated reports instead. Evidence suggests that maintaining separate correlation models for each geographic market improves accuracy because cultural preferences and platform popularity vary significantly.
One case where experts found success involved mapping discussions about modular furniture across European design forums with North American search trends, revealing staggered adoption timelines that allowed targeted content planning. Observers note that external events such as regulatory announcements or supply chain disruptions can temporarily strengthen or weaken observed correlations, requiring ongoing model updates.
Conclusion
Mapping cross-platform data correlations supplies structured insights into emerging search opportunities within niche markets by revealing relationships that single-source analysis overlooks. Organizations that systematically integrate signals from search engines, social platforms, and commerce records obtain earlier visibility into shifting interests, and continued refinement of these methods supports more precise identification of topics gaining traction across multiple channels simultaneously.